.svg)
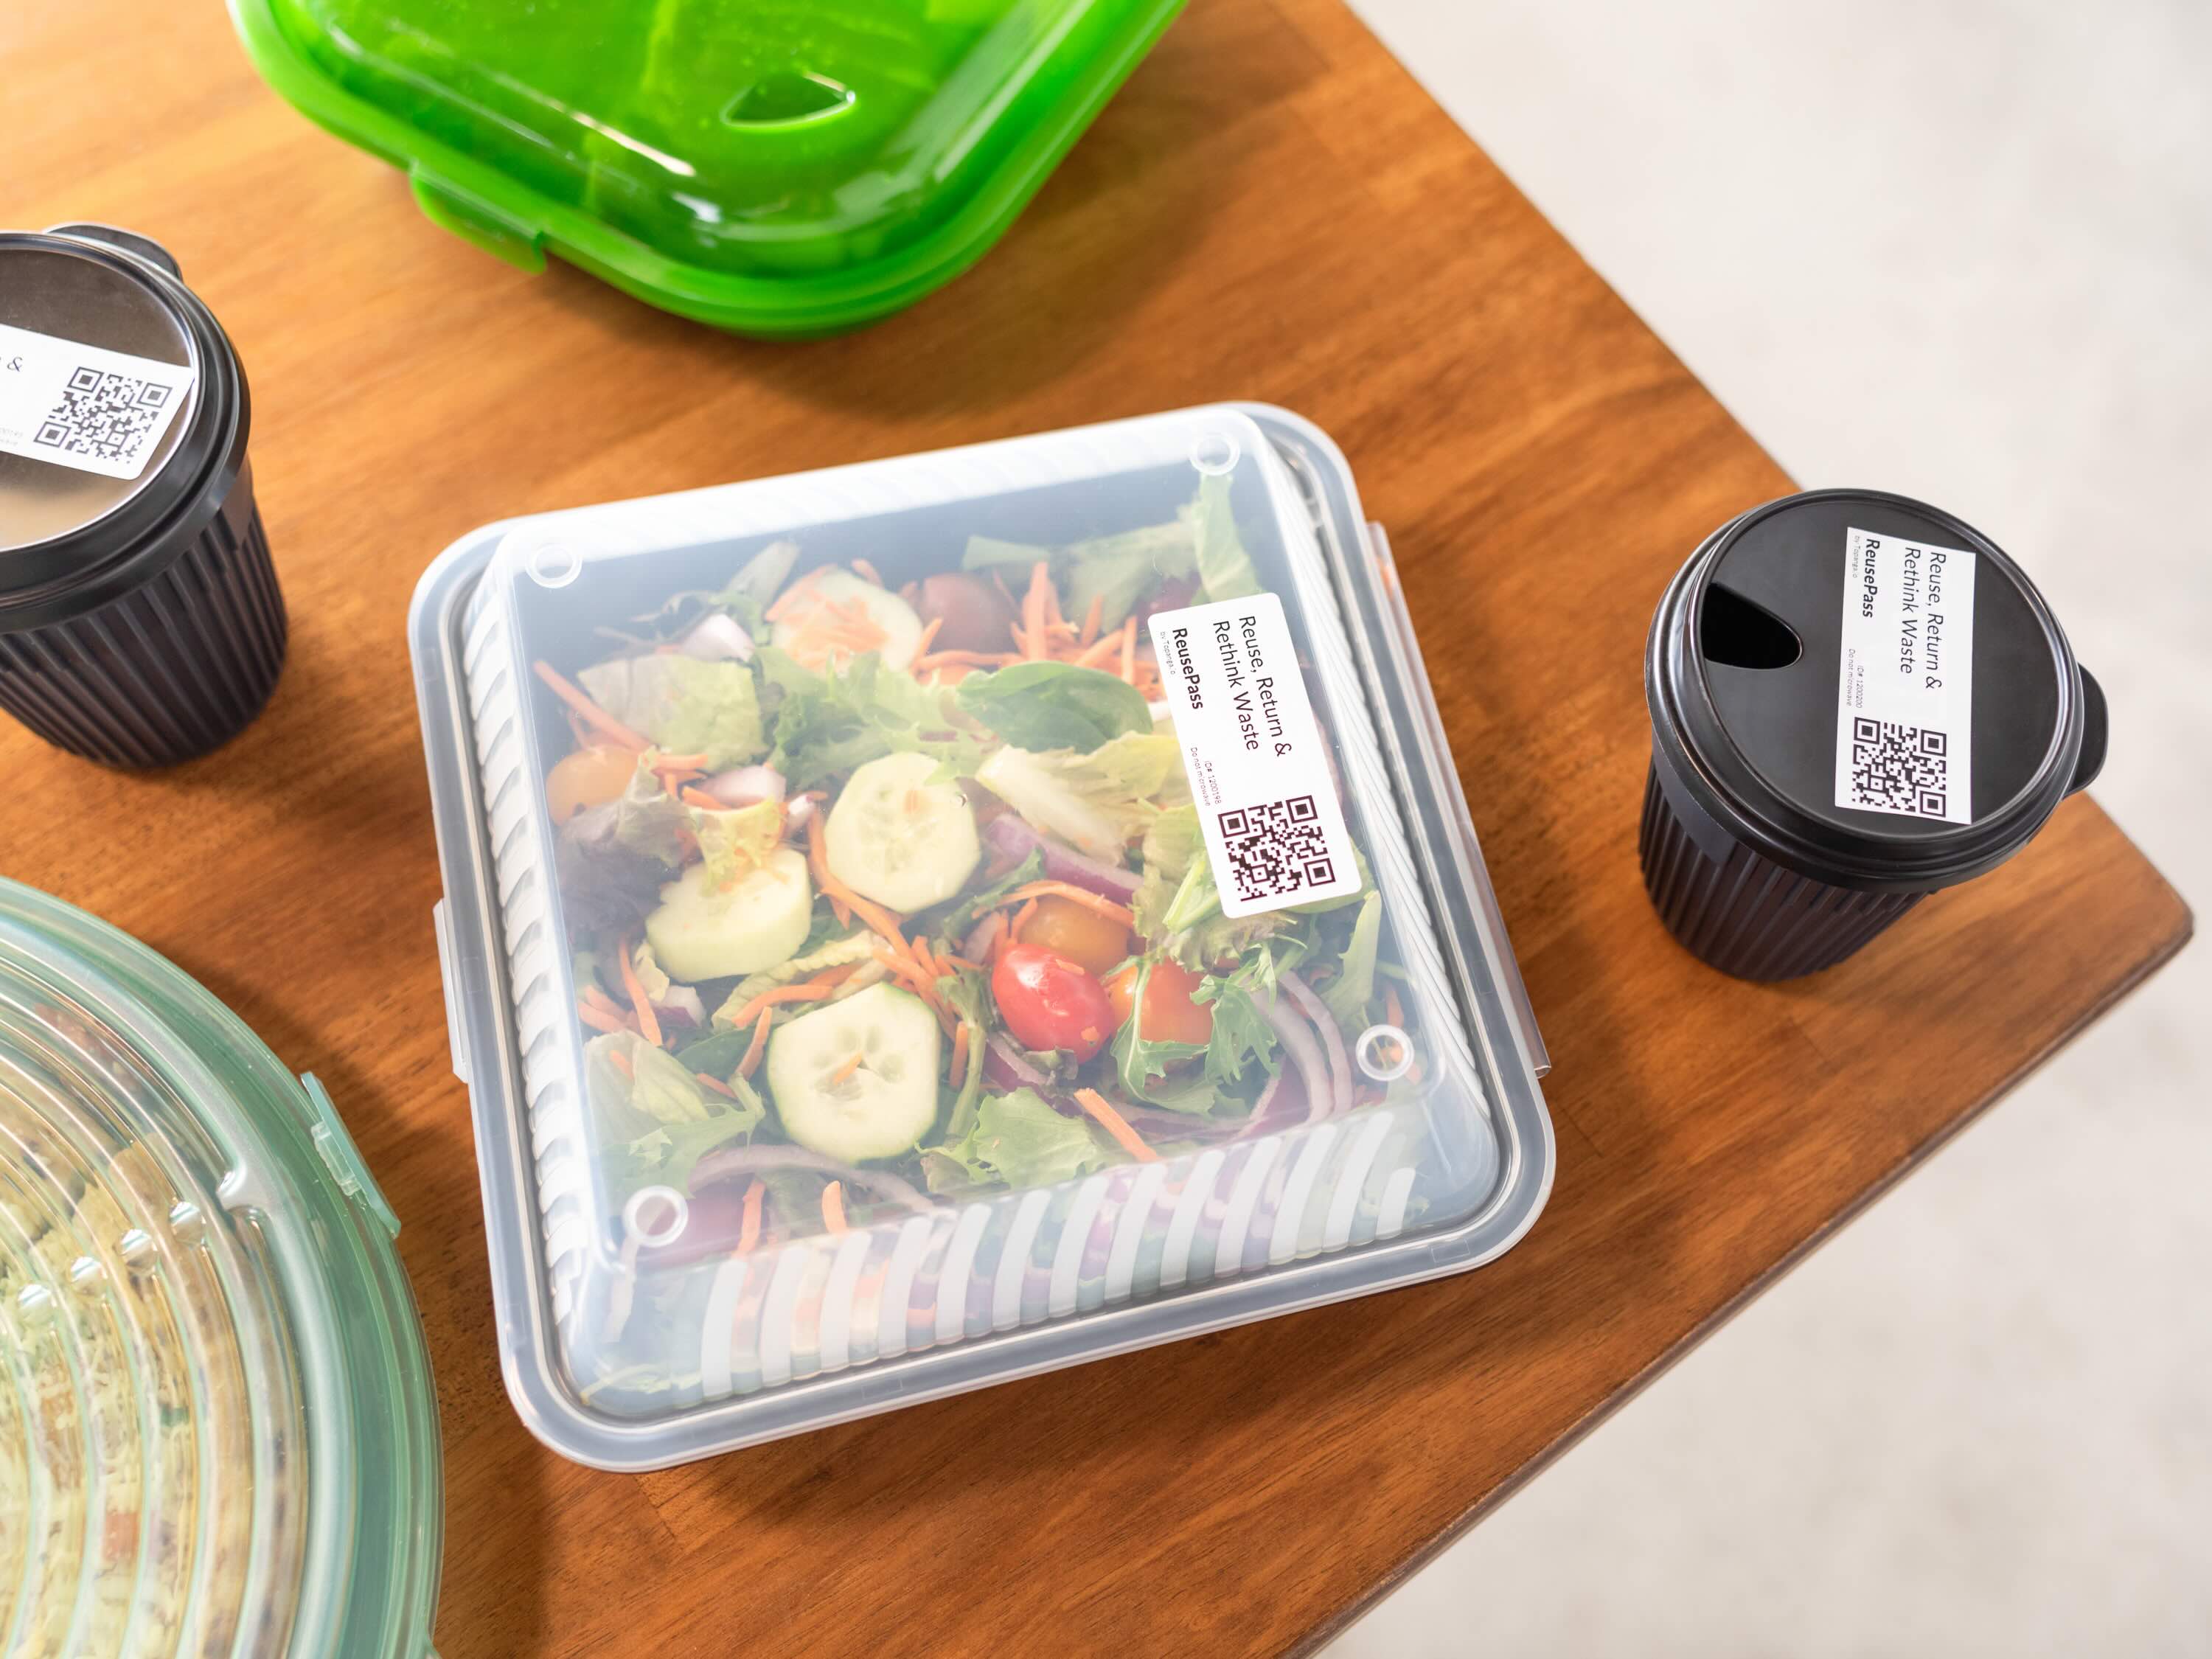
What Actually Happens to Your Reusable Containers
Understanding asset usage and loss and why, over time, a 96% return rate can still mean 23% inventory loss.

One of the most common questions we hear from ReusePass program managers is some version of: "Our return rate looks great — so why does my inventory keep shrinking?"
It's a fair question, and the honest answer is that return rate and inventory loss tell two different parts of the same story. A 96% return rate is genuinely excellent. It also means roughly 1 in every 26 containers checked out doesn't come back. And when a container completes an average of 15 loops (each checkout-and-return cycle) over its lifetime, those individual per-checkout losses compound into something more significant at the program level.
We've spent a lot of time thinking about how to give ReusePass program managers a clearer, more honest view of both sides of this equation: where assets are right now and what to expect in terms of long-term loss. This post walks through our current perspective on both.
Return Rate Alone Doesn't Tell the Whole Story
Return rate is the most visible metric in any reusables program. It's intuitive, it's motivating, and it's a genuinely useful measure of how well diners are returning containers. But it's a per-rental metric. It tells you what percentage of checkouts (loops opened) in a given period result in a return (loop closed). It doesn't tell you how many of your original containers are still in circulation.
The reason: compounding.
If you play Russian roulette with a 3.8% chance of losing, you'll probably be fine once or twice. Play 15 times in a row, and the odds of losing at least once jump significantly.
At a 96% return rate, each individual checkout carries about a 4% chance of that container not returning. That sounds small. But a container that completes 15 loops, each a full checkout-and-return cycle, has been exposed to that risk 15 times. Statistically, you'd expect roughly half of all containers to fall out of circulation by the time they've completed their average number of uses.
~3.8% loss rate per checkout at a 96% return rate
~49% expected loss per container after 15 loops
~23% typical inventory loss as a share of what you started with
This isn't a failure of the program. Much like in the kitchen where "zero food waste" isn't a realistic goal, lost containers are inevitable. ReusePass program managers need to see what's expected and where there's a bigger issue.
A real-life example
To make this concrete: one of our university clients has processed nearly 195,000 rentals since launching their ReusePass program. Their return rate model predicts roughly 7,054 lost containers over that period. Their actual lost count is about 6,238, approximately 810 fewer than expected. By the math, they're outperforming. But without context, that loss number could easily feel alarming.
That's what we set out to address.
Knowing Where Your Assets Are Right Now
Before zooming out to long-term loss trends, ReusePass program managers need a clear picture of where containers stand today: how many are actively in use, how many have been returned and are sitting on the shelf, and how many have been inactive long enough to be considered dormant or lost.
The new Asset Usage module at the top of the ReusePass Overview page provides exactly that. It gives program managers an at-a-glance view of asset status across the program, with a detailed overlay that breaks down every category. One important note: asset counts in the dashboard are based on the number of programmed QR or RFID tags registered to your program, not a physical inventory count. ReusePass is a rental tracking platform, not an inventory management system. While it gives you a real-time picture of asset status based on scan events, it is not a substitute for periodic physical counts at your dining locations.

What do the different asset statuses mean?
🔄 In circulation
Checked out (loop opened) or returned (loop closed) within the last 15 days and actively moving through the program.
⏳ Still checked out (15–30 days)
Checked out and not yet returned. Flagged for follow-up but not yet considered lost; these may still come back.
📥 Sitting on the shelf (15–30 days)
Returned (loop closed) but not yet back in rotation. Worth monitoring during peak periods.
💤 Dormant (30+ days returned)
Loop closed more than 30 days ago with no new checkout. Often normal during semester breaks or seasonal downtime.
🚫 Lost (30+ days checked out)
Loop opened 30 or more days ago with no return scan. These assets are likely not re-entering circulation.
🗑️ Retired
Deliberately removed from circulation by scanning as "Retired" in the ScanApp, typically due to damage or breakage.
🏷️ Unused tags
Programmed QR or RFID tags that have not yet had a loop opened. May or may not be affixed to a container yet.
Why is this breakdown needed?
This level of detail matters because "lost" and "dormant" are very different problems requiring different responses. A spike in dormant containers during the summer is expected. The same spike in October, when reuse should be in full swing, indicates that participation could have taken a hit and warrants a closer look. Having this visibility in one place, without needing to pull data manually, is what allows program managers to act quickly when something actually is off.
We've also deprecated the old asset type details page in favor of this unified view, which reflects how program managers actually think about their inventory: by status, not just by container type.
Introducing Expected Loss as a Benchmark
We've updated the ReusePass dashboard to surface a concept we call expected loss: an estimate of how many containers a program can reasonably expect to lose permanently, based on its return rate and the average number of uses per container.
The new Lost Assets module shows total lost containers over time alongside a comparison to the program's expected loss figure. We've also added an Expected Asset Loss heatmap, accessible directly from the module, that visualizes how different combinations of return rate and average uses per asset translate into expected loss percentages.
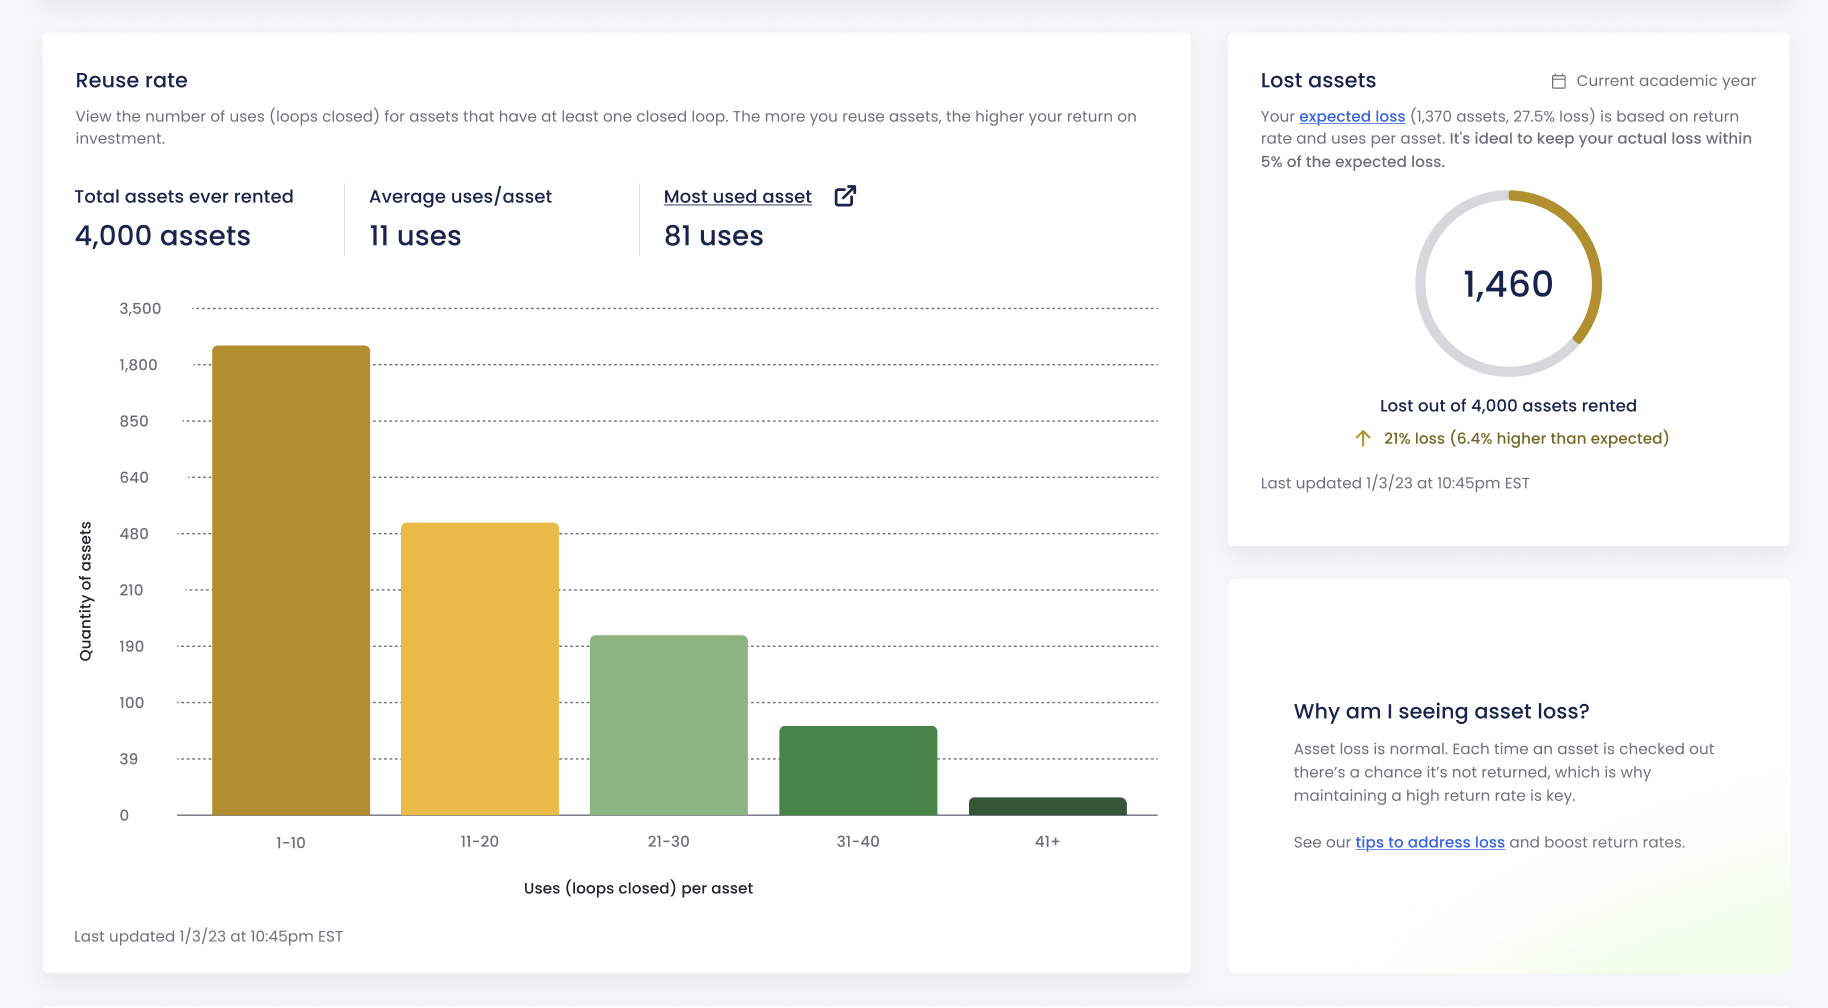
The goal is to give ReusePass program managers a benchmark. Some loss is normal and expected in any lending program. The question isn't whether you've lost containers; it's whether you've lost more than your program should have given its volume and return rate. If actual loss stays within about 5% of the expected figure, the program is performing normally.
What counts as "lost"?
A container is considered lost when it has been checked out for 30 or more days with no return scan. Assets checked out for 15–30 days are flagged separately as "still checked out" and may still come back. Assets with no activity for 30+ days after a return are considered dormant, not lost.
Understanding why containers go missing, and which status they end up in, is essential to knowing where to focus:
- Containers that count as lost typically fall into one of two buckets: a diner checks out a container and never brings it to a return location, or a container makes it back to the bin but gets thrown out before dining staff scan it in, leaving the rental open indefinitely.
- Containers that show up as dormant have technically been returned and scanned in, but have since disappeared. This could mean they were taken by staff or guests after being scanned back in, or cleaned and stored somewhere that never gets checked again.
- There's also a scenario that can make a container appear lost or dormant when it's actually neither: a damaged container that was physically removed from service but never marked as "Retired" using the ScanApp. The system has no way of knowing the container is gone, so it lingers in the wrong status bucket until someone corrects it. Regularly retiring damaged containers is a simple but important step that keeps inventory data accurate.
What This Means in Practice
These updates reflect a broader shift in how we think about communicating program health. Return rate will always matter. It's the most direct measure of diner behavior and the biggest lever for improving outcomes. But ReusePass program managers need more context to strengthen their programs.
With these dashboard updates, dining leaders get the visibility they need to make proactive decisions about reorders, inventory checks, and fees, giving them more control over usage costs and ROI.
A 23% inventory loss over a program's history isn't a failure. It's what the math predicts. The goal isn't zero loss. It's knowing whether you're above or below what your program should expect.
If you're a current ReusePass client, the updated Asset Usage and Lost Assets modules are found on your Overview page. The Expected Asset Loss heatmap is accessible via the link in the Lost Assets module. If you have questions about your program's numbers or want to talk through what's normal for your program size and volume, reach out to Topanga's Client Success team (clientsuccess@topanga.io).
If you're using a different reuse system and are still struggling with return rate and container loss, then book time with our team to see how ReusePass (and our team's hands-on support) could take your operation to the next level.
Continue reading

Plate Waste is Costing Your Dining Hall More Than You Think
New research is putting hard numbers on a problem many college and university dining operators aren’t tracking: plate waste. Topanga’s new plate waste tracking solution is designed to help teams understand diner preferences and prevent overprep.

.png)
Why Recycling Won’t Save Us
Around 460 million metric tons of plastic are produced every year, but just 9% is recycled globally. We break down why recycling alone won’t fix the plastics crisis and where the real solutions lie: elimination, substitution and reuse.